Displaying data in circular fashion is increasingly getting attractive and a great way to make art out of data!
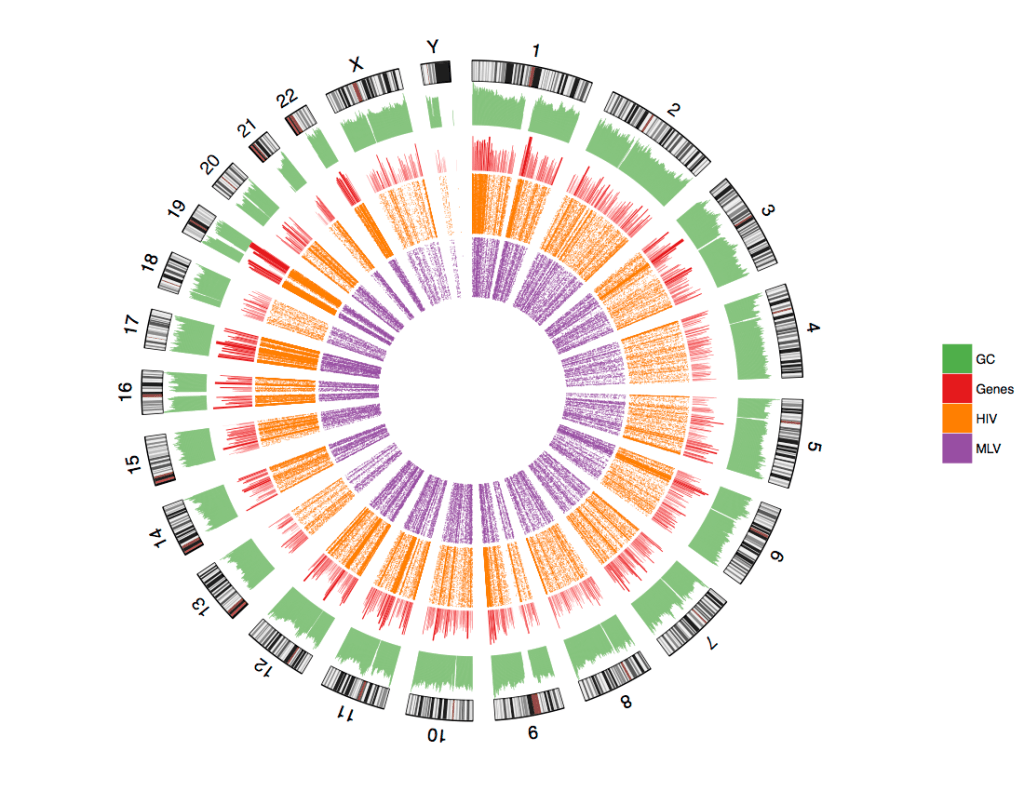
Here I show one of the many ways to make Circos style Ideogram plot of point genomic data with few genomic features. The goal here is to create a cheesy visualization of association between HIV or MLV integration sites to genes & GC content. The data and code is available at my Github repository.